After nineteen days on the ice shelf we’re all happy to be back on board Oden, with access to saunas, showers, and the wonders of the galley. In those nineteen days we drilled through the ice shelf at three sites, one near the grounding line where the glacier first goes afloat, with the other two sites 15 and 25 km further downstream.
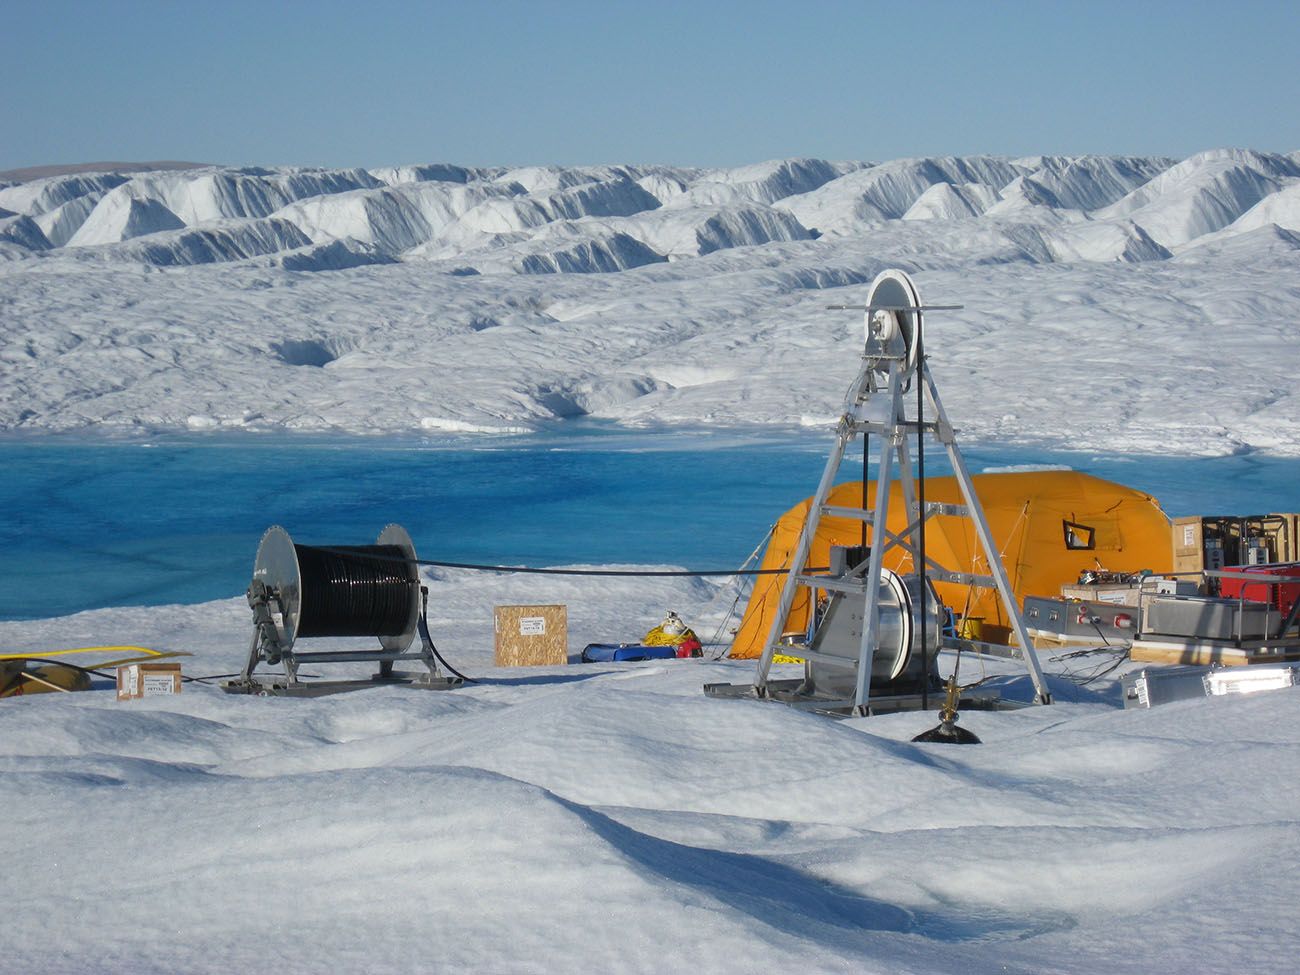

(Drill camp at site 2)
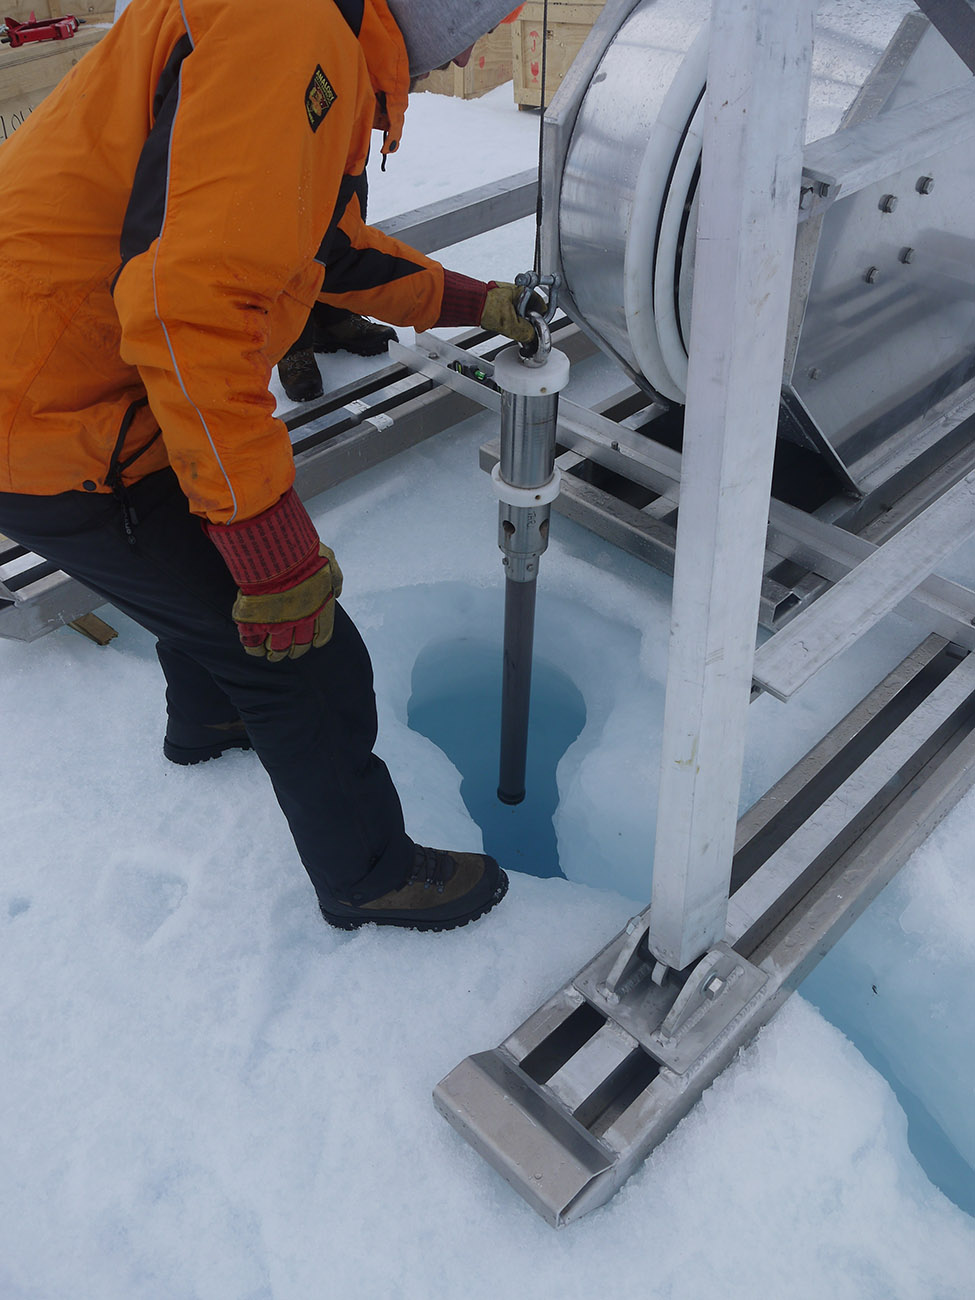
We obtained oceanographic data from beneath the ice shelf at each site, recording temperatures and salinities down the water column. We also left instruments hanging beneath the ice, staying in place indefinitely with batteries that will last several years, and sending data to loggers on the ice surface, which will be transmitted to home institutes via satellite.

(Deploying a CTD to measure oceanographic properties beneath the ice shelf)
We also managed to recover sediment cores from the seafloor at two of the sites. Sadly, however, the third site, nearest the grounding line, proved impossible for core recovery.
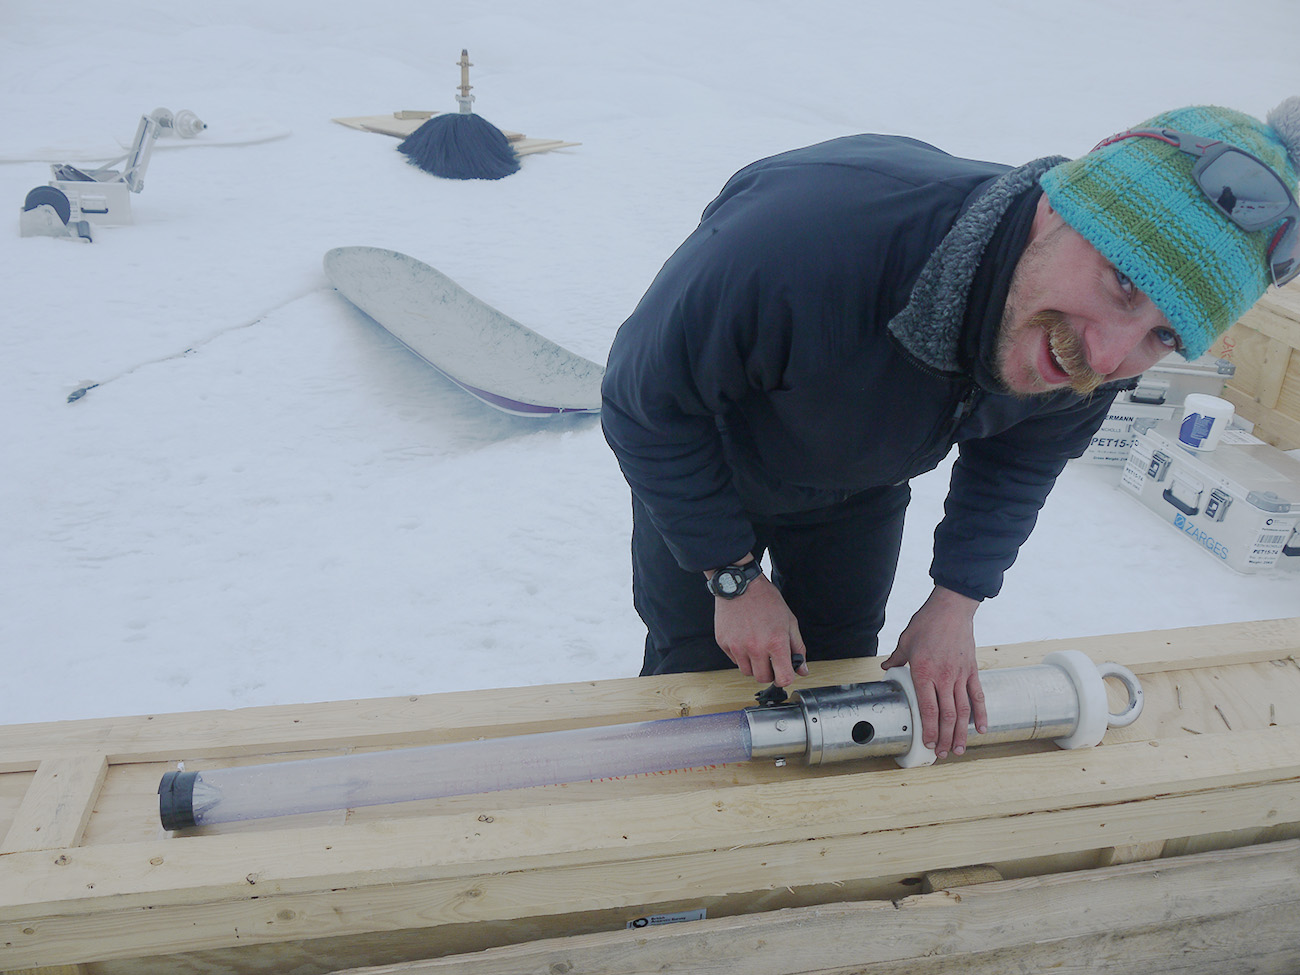
(Setting up and recovering the mini corer)
Finally, we left radar systems at two of the drill sites, allowing us to monitor the rate of melting of the ice shelf over the next year or two.
By fixing a GoPro camera in a deep-water housing to the rope that was used to lower one of the corers, we were able to get fascinating footage of the descent through the borehole, passage through the water column, and then of the sea floor itself. The sediment load in the ocean water was easily visible – everything from a milkiness that obscured the top of the corer, through to what we presume to be flocculating sediment streaming past, together with fleeting glimpses of “bits of biology”. Tracks left by small animals were also visible on the seafloor, suggesting a busy habitat under the ice shelf.
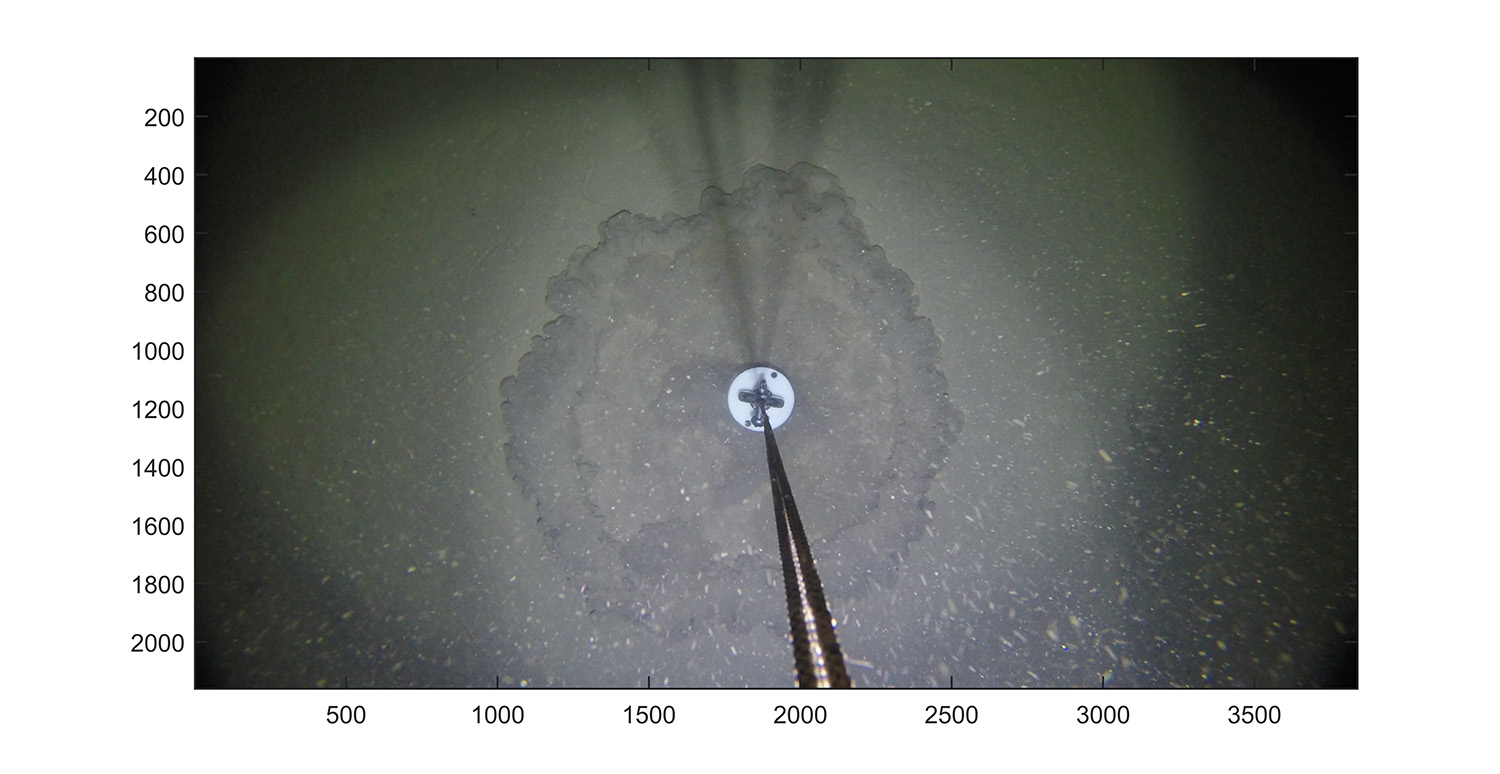
(When the corer hit bottom)
We found much of the water column beneath the ice shelf to be filled with “Atlantic Water”. At about 0.3°C, this water is the warmest seen outside the ice shelf, and it can clearly find its way right to the grounding line. This represents a huge reservoir of heat available to melt the ice shelf, should it come into contact with the ice shelf base. The temperature and salinity characteristics that we saw show the importance of “runoff” – water either derived from melting at the upper surface of the ice shelf that has somehow made its way beneath the ice, or from melting at the base of the glacier at the grounding line, which has then flowed out into the ocean cavity. Because the runoff has a lower density, it can flow up the tilted base of the ice shelf as a turbulent flow, helping to mix the warm Atlantic Water upwards towards the ice base, potentially causing melting.
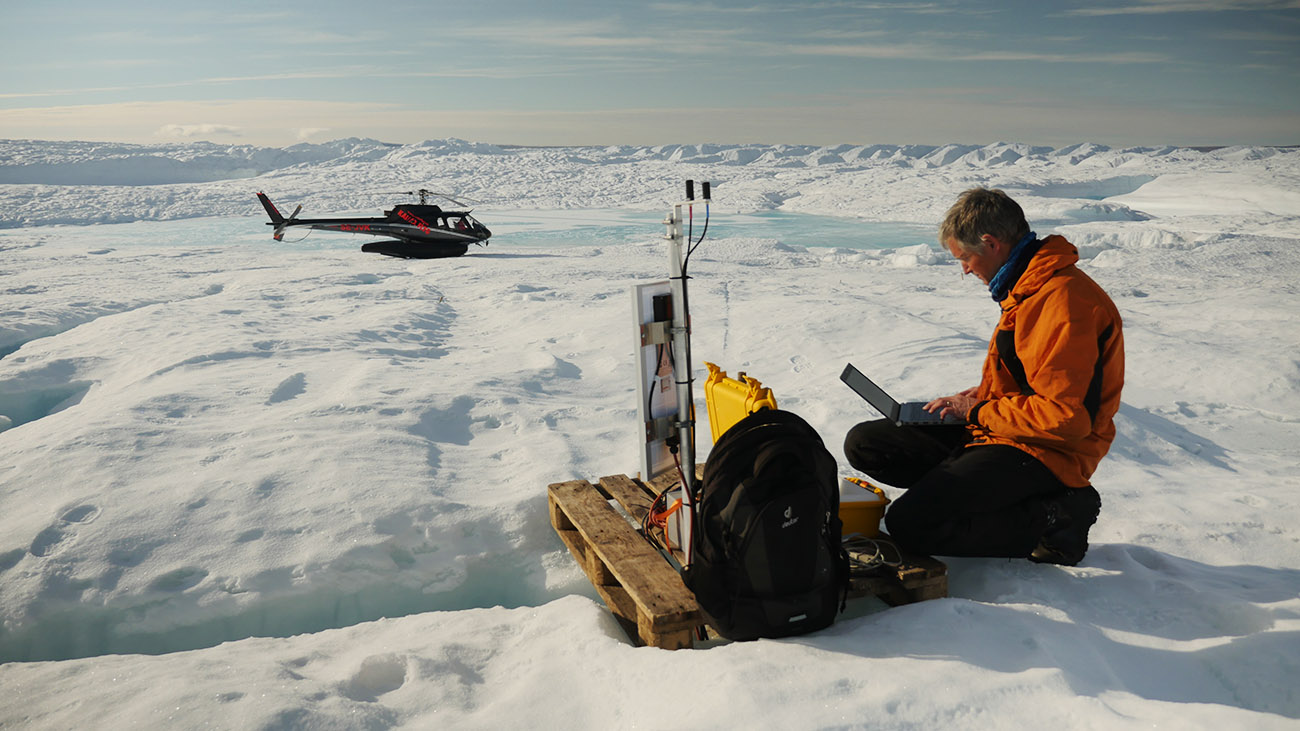
(Checking data logger a week after deployment)
Although we had enough equipment to establish five sites, priorities intervened in a way that limited us to three. That said, the fact that nine instruments deployed beneath the ice shelf, the two radar systems left on the surface, and an automatic weather station are all working perfectly testifies to the success of the season. The GoPro footage has given us a unique view of the conditions beneath Petermann Glacier, and the recovery of the sediment cores beautifully complements the work undertaken on the ship. In fact, many unanticipated linkages between the ice shelf activities and other aspects of the overall programme have been a delight to discover, promising fruitful collaborations during the period of data analysis to come.
Written by: Keith Nicholls of the British Antarctic Survey


Congratulations to a fantastic achievement! Look forward to seeing all the exciting results from this in the years to come!
LikeLike